
The National Association of Dental Plans recently published the 2015 NADP/DDPA Joint Dental Benefits Report: Enrollment. The following infographic from the report depicts dental benefits from 2006 – 2014, illustrating several key findings about enrollment trends. As of 2014, 60% of the population of the United States had some form of dental coverage.
Enrollment in Dental Plans
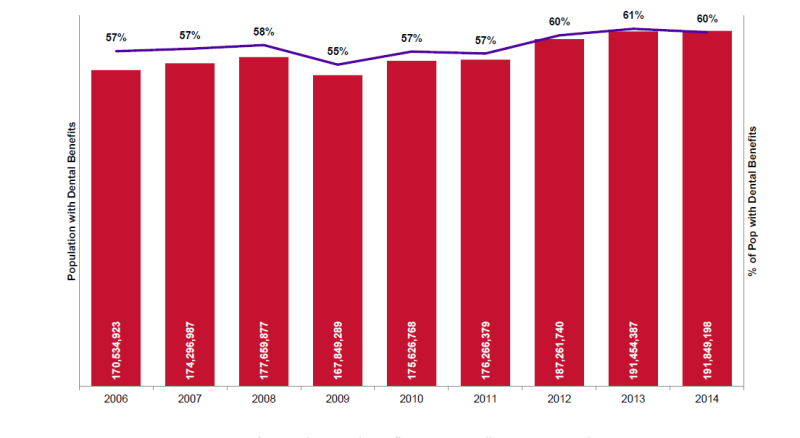
Key takeaways from the report include:
- Over the past eight years, dental benefits are gradually increasing across the population
- From 2013 to 2014, the percent of the population with dental coverage fell approximately 1%
- For commercial dental organizations, DDPO product enrollment increased 3% from 2013 – 2014
- Self-insured group dental benefits decreased to 48% of all commercial group enrollment
As PLEXIS monitors dental-specific trends in benefit administration such as enrollment growth, we continue to meet the speed of change with our integrated clinical, financial, and administrative payer platform. From numerous dental-specific solutions to accelerate auto-adjudication, to streamlined workflows for dental benefit administration, to responsive dental customer service, PLEXIS provides agile tools for payers’ success.
Learn more about how the PLEXIS platform empowers collaboration and greater business efficiencies such as automated premium billing. resulting in more accurate and on-time payment to providers, accelerated cycle times, and higher levels of automation which ultimately reduces the cost of benefit delivery.
Infographic Source
NADP/DDPA 2015 Dental Benefits Joint Report: Enrollment, September 2015 pg. 10, Dallas, Texas. Ordering information at www.nadp.org.